What Is Cloud Computing? 4 Service Models, Origins, Pros & Cons
Read more

Finout is the first self-service, zero-code cloud cost observability platform that combines your cost with real business metrics, slicing it up into customers, features and unit metrics. You can even create your own dashboards to manage spending you're responsible for.
Finout can be set up in minutes without changing code or adding an agent. You can use it to break down spending by cloud providers, including Datadog and Kubernetes for example, and make better decisions about your cloud usage.
Let's dive into the key features.
Datadog for Dashboards
Monitor, manage and reduce your Datadog costs within Finout. You can easily add Datadog dashboards into Finout and start monitoring your cost in real time.
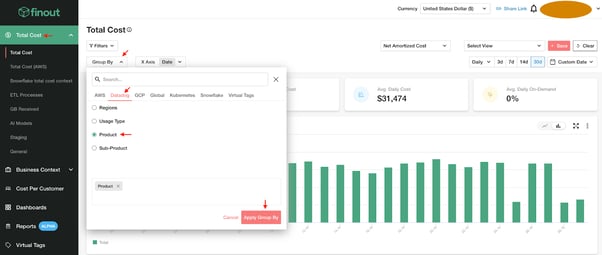
Figure-1: Grouping your total cost by Datadog spend
To drill down deeper, filter your data by APM, logs, infrastructure, and more.
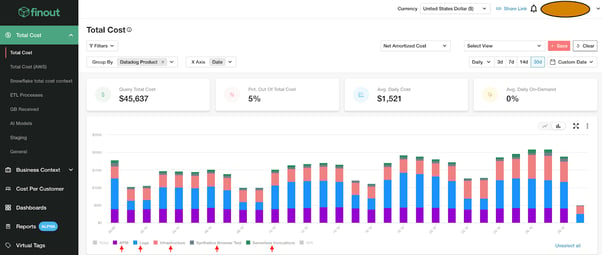
Figure-2: Using filters to analyze Datadog spending
Understand and Take Ownership of Kubernetes Spending
Finout lets you visualize and manage your Kubernetes costs, down to individual pods running in your cluster.
To get started, add a dashboard related to your Kubernetes infrastructure. You can then filter the data by environments, resources and labels.
You can also choose your environments like dev, stage, and production as you're getting the dashboard set up. In the Resources tab, select which clusters and namespaces you want to monitor and add them to the graphs. Finout also supports any specific labels in your Kubernetes cluster.
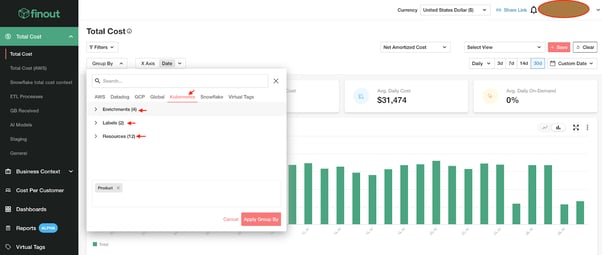
Figure-3: Managing Kubernetes spending with Finout
Business Context KPIs
When you try to analyze Kubernetes costs on your own, there is no context about the workloads being orchestrated.
The powerful thing about Finout is that it comes out of the box with features that let you understand cloud spending in a wider business context. The tool translates your technical costs into business KPIs, including cost per feature, customer or event.
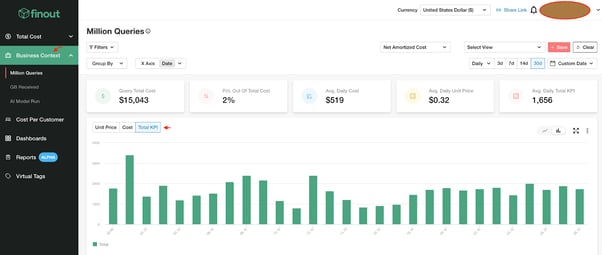
Figure-3: Business Context KPIs
Create a Finout Dashboard Within Datadog
Finout integrates with Datadog to give you a granular view of your spending directly from your Datadog UI.
You can also view data from Snowflake, AWS, GCP and your Kubernetes clusters.
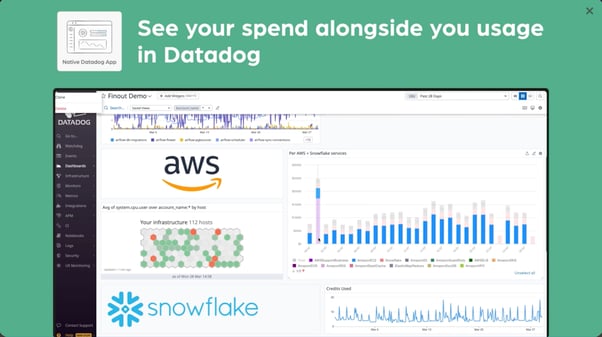
Figure-4: AWS and Snowflake dashboards in Datadog
Monitor Datadog Spending
Monitoring and cost observibility is an important way to optimize your resource usage. There are a number of ways you can do that with Finout. Let's take a look.
Finout lets you monitor and manage your Datadog spending by quickly finding wasted resources and improving usage.
DevOps teams spend a lot of time monitoring their infrastructure inside Datadog, so it makes sense to monitor its associated spending, too. Any Datadog user can view the cost of AWS, GCP, Kubernetes, Snowflake, and even Datadog, from Datadog's native platform.
Improve profit margins and make data-driven business decisions using Datadog metrics; break down your shared costs into any business KPIs, including cost per event, feature, team, customer, and more. Then customize FinOps Dashboards and give access to Finance, Sales or any other team that needs this visibility.
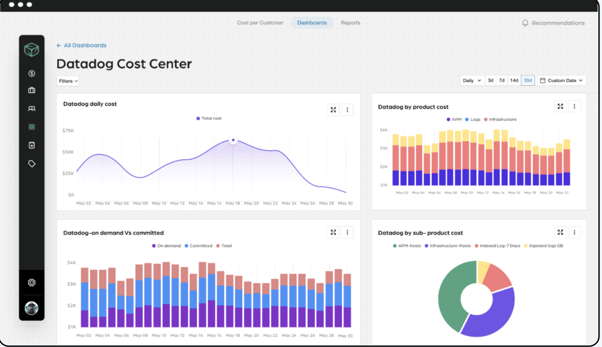
Figure-5: Monitor your total spend with Finout
Add Datadog to your MegaBill
Naturally, Datadog costs will constitute just a fraction of your cloud spending. See in one screen your infrastructure costs including AWS, GCP, Snowflake, Kubernetes and more, then start reducing it.
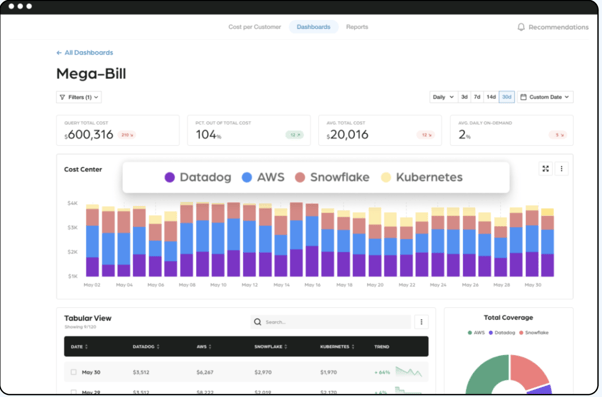
Figure-6: Adding Datadog to your Mega-Bill
Add Business KPIs to Datadog Spend
As mentioned before, you can convert Datadog spend into Business KPIs. You can combine your Datadog services with EC2 services or K8s namespaces and transform them into cost per feature, event, or customer to understand how much your customers are really costing you.
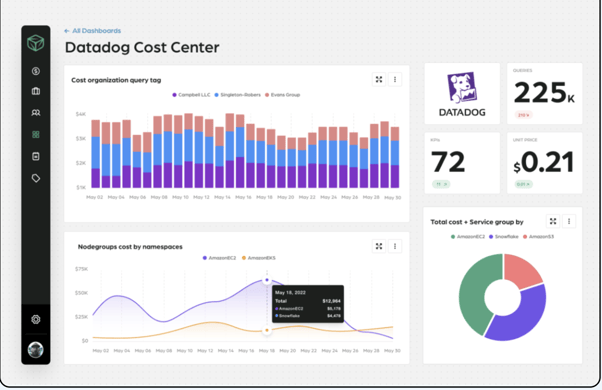
Figure-7: Business KPIs that correlate to your Datadog spending
Make Use of Finout's CostGuard Feature
CostGuard provides industry-leading cost shock prevention for your public, private and hybrid-clouds. You can start detecting cloud waste, spot anomalies, and get spend recommendations immediately using Finout's CostGuard feature. Also, you will get an agentless Kubernetes spend view (and cost optimization).
Finout uses Datadog connectors to break down abstraction and give you full cost monitoring and optimization capabilities. This lets you optimize Kubernetes usage, for example, including GKE and EKS, and underutilized services, all from one dashboard.
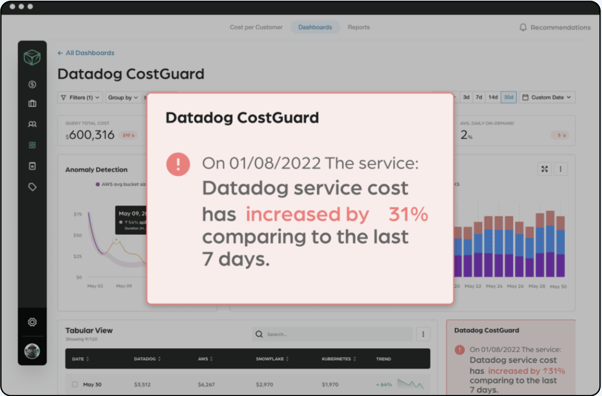
Figure-8: Costuard feature in action
Final Thoughts
Finout provides you with powerful features that let you monitor, manage, and optimize Datadog spending.
Request a demo now to see how efficient analyzing and managing your Datadog costs can be.