


This article was originally published here - by Finout's Software Engineer: Boris Cherkasky
Do you remember the moment you learned logs aren’t free? I for sure do. It was just after a major milestone our team achieved — we’ve just launched a new and shiny scalable service that is about to replace a legacy extremely high throughput, and extremely inefficient service. We just reduced the fleet size from ~300 EC2 instances, to ~30 pods on a multi tenant Kubernetes cluster. Achieving better reliability, lower processing latency, and reducing cost by order of magnitude.
It was then, we unintentionally made our log provider bill skyrocket. We were logging large volumes of data in high throughput. We almost erased the whole operational cost saving.
It was then I learned how expensive those logs I use daily and seamlessly without much thought, can be.
In this post, I’ll cover the steps we took to reduce costs around logging generated by our systems, and general practices on effective logging.
Any Optimization Starts With Measuring
We can’t optimize log usage if we don’t know how much we use, what we’re logging, and why.
At the time we were using a third-party vendor for logs — a managed ELK platform if you may.
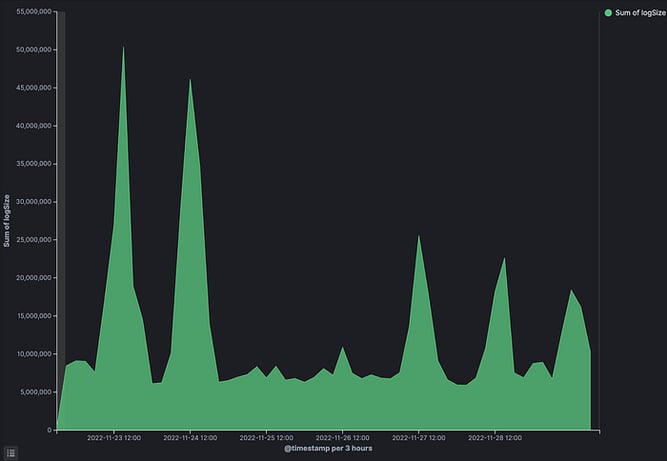
So we first started by measuring how much logs we’re indexing, and who are “the main offenders” — i.e. what are the logs being sent the most.
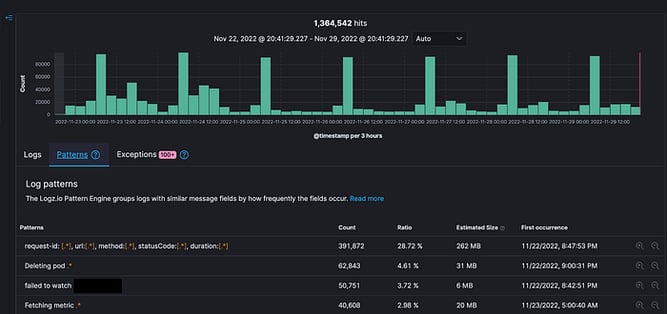
The two cool things that can help you here (while using Kibana, but can probably be applied anywhere) is to measure log size:
And the template tab that shows most common log patterns:
Since this was a brand new system, we never used logs generated by this system yet — so their value was quite hard to access — while the cost was obvious. This got us to think hard about the system as a whole.
Understand The Usage
What will your logs be used for?
- Will they be used only during outages to understand what goes on in production?
- Are logs used for auditing purposes to understand a request journey? Will they be used to debug business use cases?
- Are those logs valuable after one hour? After a day?
- Does the system serve long lasting requests? Or are the requests temporal?
- Are logs part of any regulatory requirement?
- What’s the cost of an outage?
We asked ourselves all those questions, and those served as the basis of understanding where we should put the logging focus, and where we can save cost.
Let’s go through few examples:
Let’s say you have a system where every request is critical, each failed request will negatively affect the business of the company. Best example for such a system is an e-commerce site — each order failed to be placed is lost revenue! We’d probably want to log each step of that request’s journey to know what happened, what failed, and maybe be able to use those logs to answer questions such as “why does the order go through flow X and not flow Y”.
In such a use case logs are very valuable, and should be retained for a fairly long period — probably 7–14 days.
A good rule of thumb for your required log retention period — the general time it takes to support inquiries and requests get back to you.
In our case though — the requests were of a supporting system, no close correlation to revenue, each request is very short-lived and temporal, and the cost of outage is quite low.
Moreover — the system had a very low number of processing flows. Therefore the probability of an issue to be affecting only a specific subset of requests is very low — i.e. in case of an issue, it’ll probably be a whole or nothing kind of outage.
In addition — no request—level auditing is needed, no one will ever ask us why request X behaved the way it did.
This analysis got us to the following conclusions:
- The single request is meaningless in our system
- Other than processing failures, we couldn’t come up with any reason for us to check the logs of the system (we got its behavior and SLI covered by metrics monitoring)
- The data is so temporal, that there’s no chance anyone will care about requests a few hours after its processing
Those basic facts about our systems’ behavior allowed us to start engineering our way for a solution.
Using The Correct Retention Time
We started by a quick fix — reduce the retention of our logs to a minimal 1 day period, this allowed us to cut the cost back down quickly, before addressing the root underlying issue.
But there’s a lesson here too — the default 7–14 Days retention levels most companies use are quiet random defaults and can have anything between 10–90% impact on costs.
Think about how long your logs remain valuable in your use cases. Adjust the retention to the minimal value.
Extend and reduce the retention levels needed dynamically as your needs change — large feature release is an awesome cause for longer retentions, while long maintenance windows may be good chances to reduce retention.
It has a great difference if you have 5TB of daily logs that you store for a day, or a month.
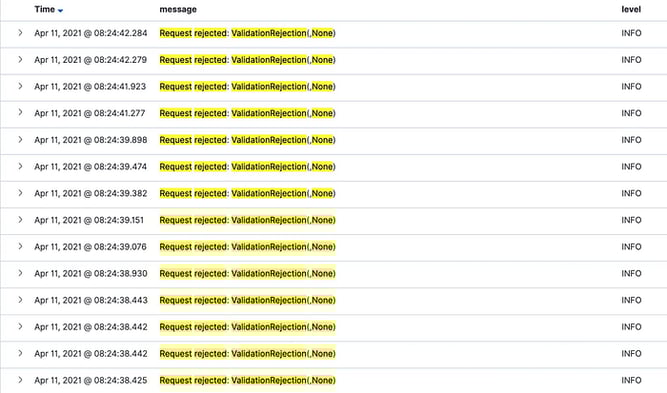
Meaningful Logs and Not Using Logs as Metrics
It is quite common to see log messages like “Serving request”. Unless you log what this request is, and there’s a real valuable meaning behind this request — this is a metric, this can be replaced by a simple counter!
Those logs are quite meaningless:
So, don’t use log for metrics, use metrics for metrics, it’s cheaper, and far more effective.
As for logs — log meaningful data, if this request is valuable, log what this request is, how to find it, what makes it meaningful, and it’s data! Something in the line of:
Serving Premium account <account name>, request <id>, <some additional context about the flow and request>
Since we’ve built a high throughput service, we’ve deleted ~hundreds GBs worth of “Service requests”, and “finished process x”, reducing our logging cost by ~5–10%.
Moreover — this cleared our cluttered service logs, and made issue-hunting much easier.
Severity Based Logging
We usually set the minimum log level in production for INFO, in that way we exclude or the debugging lines we used to develop the system, while not losing context for what’s happening.
We decided to go further up — and put the log level on WARNING, and later on ERROR.
We learned that we don’t need the context, and we only care for logging when the system is failing and crushing.
This cut down our log usage by an additional ~90%, without any real usability loss.
We’ve added a dynamic configuration flag that enabled lower log levels on demand for any case.
Dynamic Logging
As we started reducing logs, it became clear that manually running things in production and staging environments became a bit more difficult, since our logs were almost always empty.
It became clear that even though we rarely use logs, we still need some indication on what goes on in our systems. we need *some* logs.
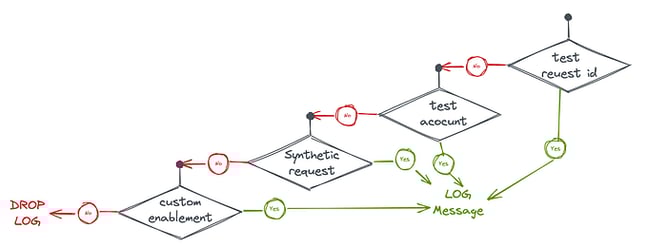
We’ve built in a mechanism that decides dynamically whether to log a request’s logs by the properties of the request. For example:
- For testing and exploration, we enabled logging for any request id starting with
test. Or sent out from some of our test accounts. - We’ve enabled full logging for Synthetic test requests by properties of the tested request, so we’ll have some constant control group.
- For product/customer onboarding, we’ve enabled logs during the first stages of onboarding by customer-name prefixes.
All those capabilities were controlled by feature flags and configurations that can be changed in zero effort.
This kept our costs down while enabling better usability of our system.
Trace level Sampling
Generally, I’m not a fan of sampling solutions. Sampling for those of you who are not familiar — is using a feature only on a subset of the traffic or use cases — for example, enabling logs for only 10% of traffic, or only traffic from a specific IP space or region.
In our case we can easily reduce cost by logging only on a subset of pods in our deployment or logging only a small % of requests.
It’s a fairly common use case for reducing operational costs. In our case though, after all of the optimizations were done, we saw no reason to go that way, but if you do choose to do so, please remember to log the whole request log, and to sample each log line in separation — you’ll get broken flows and no real value that way.
Limiting “Error Storms”, Predictable Logging Costs
Since our system now logs only log messages with ERROR severity, we’ve discovered an interesting phenomenon, that we’ve nicknamed “error storm”.
Error storm is what happens in your system when it gets to an erroneous state, an outage. When it happens our logs get filled with a massive wave of repeating error logs, logging the same error over and over again. And on a massive scale — it has very little value.
We’ve implemented a small in-memory latch (a mechanism that “locks” in a certain state), that latches when the same log message is logged more than X number of times and stops the error storm.
This gave us enough information about the error, and stopped the flood of errors, thus reducing additional costs during outages, and more important — making our logging costs predictable during outages.
It is also important to mention here that we had great metrics coverage. Therefore we needed those error logs only for context and additional information about the error at hand.
Limit Vendor Lock-In and Switch Vendors
We were able to reduce ~50% of the overall cost by switching logging vendors.
Essentially, we were paying for a glorified managed OpenSearch (ElasticSearch at the time), but we weren’t using much of the advanced capabilities of the tools.
Most of our visualizations were metric-based, and the one we had on logs, was basic Kibana visualization, that’ll work on any other platform that supports Kibana.
So through a not-too-complicated migration process, we were able to save large sums of the overall logging costs; some of the vendors have migration processes to ease moving from their competitors. Use it.
If you’re not leveraging advanced features of your logging platform of choice, and your monitoring stack is not exclusively, or mostly log based — don’t be afraid to go vendor shopping and into pricing wars.
Don’t Be Afraid of SSH and Kubectl
In some (usually very stateless systems) you don’t necessarily have to have centralized logs. If your security requirements allow it, You can default to connecting to a machine using the tool of your choice, and tail-ing, cat-ing, and less-ing log files and stdout. I know it’s barbaric, and every 1998. But it works, and it’s cheap.
In our systems, even though the ELK logs were of Error severity, all INFO logs were still available in a rotating log file on the instance, so by accessing the instance, we could get a lot of contexts if needed to.
Since we had such amazing cost reduction achievements through the above-mentioned steps we haven’t really gone that far, but we did a small POC of using logs in this way, and it wasn’t too awful in our specific use case.
Final Thoughts
You may think we went overboard here, and over-engineered ourselves here. You’ll probably be right. But:
Firstly, We used this cost reduction effort as an additional leverage during pricing negotiations with the logging vendor, so it had added value and we can actually put a price tag on it.
Secondly, other than the “latching” mechanism, most of this effort was really low-hanging fruit with minimal development effort needed.
Thirdly, we used this effort as a learning opportunity for some of the junior developers in the team, focusing on the difficulties of doing anything at scale — and “training” their minds to think — scale in anything they put their hands on.
The bottom line, Logs the cost shouldn’t be the first item on your agenda, but they are part of your observability posture, and they can be a huge spend.
It shouldn’t be.
As always, thoughts and comments are welcome on twitter at @cherkaskyb

.svg)
