


.svg)


Finout vs. CloudZero vs. Ternary: The 2026 Comparison Guide
Read more


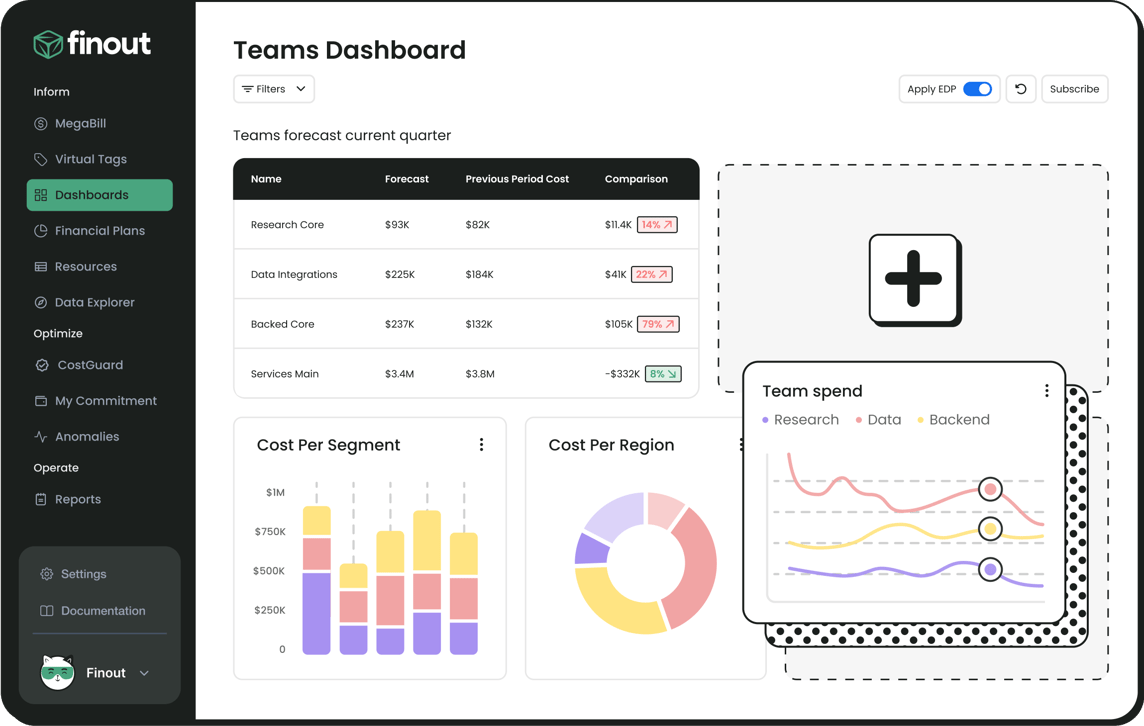

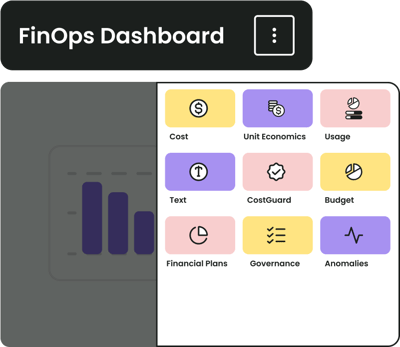
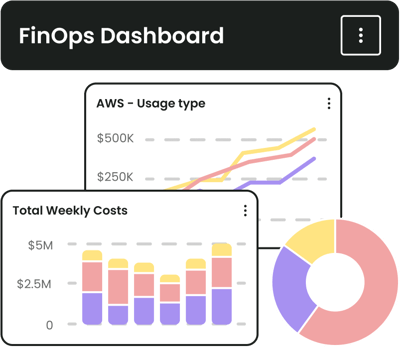
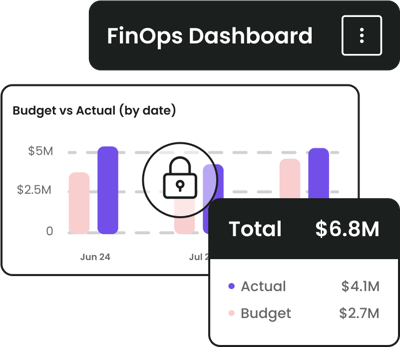
Build fully customizable FinOps dashboards with a simple drag-and-drop interface. Choose from a range of visualization widgets to showcase your data and highlight the metrics that matter most to your teams.
Stop wasting time scrolling through countless graphs and dashboards. With Finout, you can view all your cloud data and metrics in one centralized place—and easily customize views for your teams, departments, or applications.
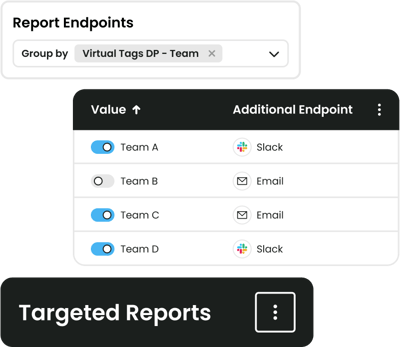
Easily send dashboards as reports via Slack, email, or Teams directly to specific teams or endpoints using Virtual Tag values. Deliver only the data each department needs, simplifying report distribution and enabling better decision-making.
Ensure data security and compliance by controlling who can view or edit dashboards and reports. Grant stakeholders access to only the data they need while protecting sensitive information with customizable permissions.


Finout is an enterprise-grade FinOps solution that helps companies easily allocate, manage and reduce their cloud spending across their entire infrastructure.
© Finout 2026. All Rights Reserved. Privacy Policy Terms of Use
© Finout 2026. All Rights Reserved. Privacy Policy Terms of Use

