



Bring FinOps clarity to Grafana Cloud

Connect Grafana Cloud to Finout with an API token, see daily costs by service and stack, and control observability spend alongside the rest of your cloud bill.

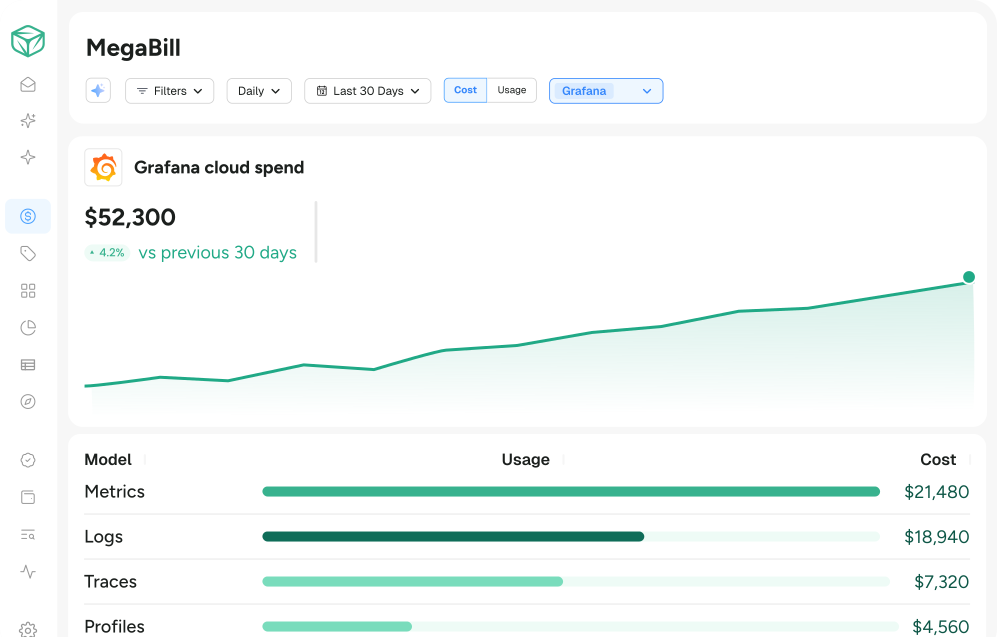
Grafana Cloud's billing console shows your Grafana bill. Finout shows Grafana in context- daily costs by service and stack, allocated to teams, next to AWS, Datadog, and the rest of your spend.

Garfana-integration-hero
Cloud-Top

The best FinOps teams run on Finout

Secure by design. Built for scale.

SOC-2

SOC 2 Type II

Independently audited controls.

GDPR-2

ISO 27001

Certified information security.

GDPR (1)

GDPR compliant

Privacy by design.

GDPR (2)

Read-only access

Metadata only — never code.

01

Connect in
a click

One read-only Grafana Cloud API token plus your org name, validated instantly.

02

See every GB and series

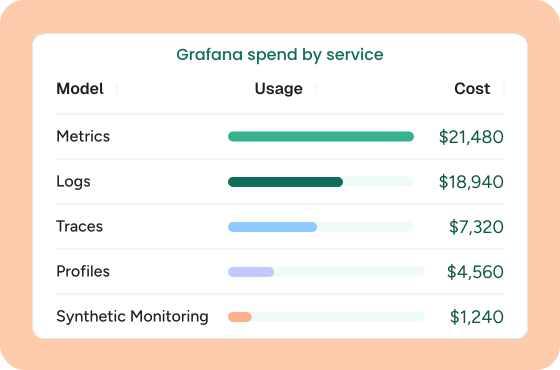
Daily costs by service — Metrics, Logs, Traces, Profiles — with usage units like GB and series next to every dollar.

03

Allocate spend by team

Allocate to teams with Virtual Tags, track trends, and catch spikes with Anomaly Detection.

Integrations

Connect Grafana in minutes

Create a read-only Access Policy token in Grafana Cloud with the org-billing-focus:read scope, add your org name, paste both into Finout. FOCUS-standardized cost data refreshes daily, with up to three months of history backfilled on connect. No agents to install, no Grafana changes, no per-stack setup.

connect-grafana

Visibility

Understand Grafana costs

Grafana's billing console shows your invoice total. Finout shows which product, team, or cost center drove the spend- by mapping each Grafana stack to your team, product, and Virtual Tag taxonomy. Spend breaks down by service (Metrics, Logs, Traces, Profiles) with usage units like GB and series next to every dollar.

understand-grafana
quote-connect-left2 quote-connect-right
"I have witnessed firsthand the impact of this strategic partnership on our ability to make data-driven choices, reduce unnecessary cloud spending, and accelerate our innovation efforts."

Vijay Kurra

Vijay Kurra

Lead Cloud FinOps & Analysis

Completeness

Bring Grafana into your
AI cost strategy

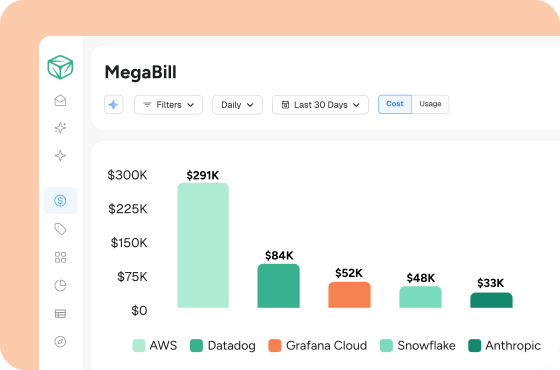
Grafana Cloud is one cost line. The Datadog spend it adjoins, the AWS infrastructure it observes, the Anthropic bill covering the same teams- all of those live in different consoles. Finout puts every line in one bill, so a Grafana Logs spike and a parallel AWS surge are obviously the same incident.


bring-grafana

Detection

Be alerted when Grafana costs spike

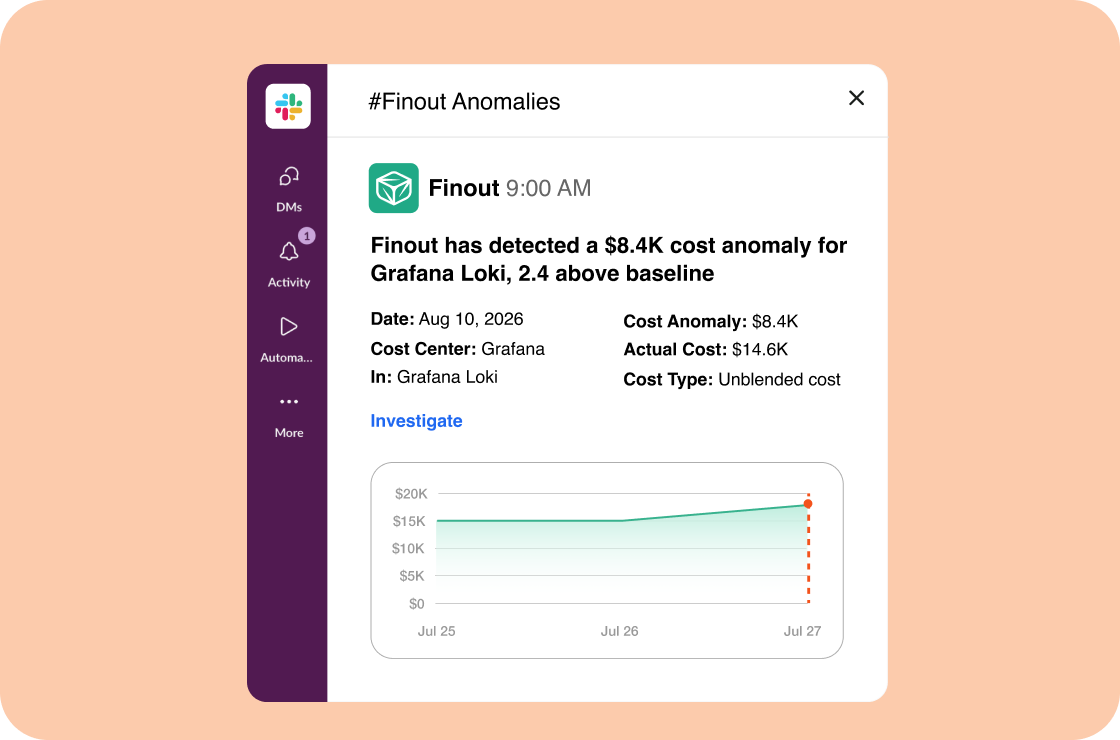
The most common Grafana surprise is a single service that suddenly burns multiples of its baseline- usually a runaway log stream, sometimes a metrics cardinality explosion. Finout catches both at the daily-snapshot level and routes alerts to Slack, email, or PagerDuty before finance asks.

alerterd-grafana

Integrate with Finout

Grafana joins your full AI and cloud stack- one platform for every provider you spend on.

Ready to connect your infrastructure?

Get a single view of your Grafana, AI providers, cloud, and SaaS spend- allocated, monitored, and forecasted in one place.