TL;DR: Kubernetes monitoring tools track the health, performance, and cost of dynamic containerized clusters. If you need to know who owns cluster spend, Finout, an enterprise-grade FinOps platform for cloud and AI spend, allocates 100% of Kubernetes cluster costs to the teams and features that use them.
Health and performance need their own layer, and most teams combine more than one tool. Datadog covers metrics, logs, traces, and security in one SaaS platform, Prometheus handles open-source metrics and alerting, and Grafana Loki aggregates logs at low storage cost.
Effective Kubernetes monitoring requires tools that can handle the dynamic, ephemeral nature of containerized environments. Most container users now run it in production: in the Cloud Native Computing Foundation's latest Annual Cloud Native Survey, 82% of container users run Kubernetes in production, up from 66% in 2023. Open-source stacks built on Prometheus and managed platforms such as Datadog and Dynatrace solve the same visibility problem with different tradeoffs in operating effort and pricing.
Kubernetes monitoring tools gather and analyze data from various components, such as nodes, pods, services, and controllers, to provide insights into system operations. Their primary goal is to help administrators detect and resolve issues quickly, maintain high availability, and ensure efficient resource utilization across dynamic, containerized environments. These tools are essential for maintaining reliability and performance in modern, cloud-native architectures.
This is part of a series of articles about Kubernetes cost optimization
The table below summarizes the key differences between the tools covered in this article. We explore each of them in more detail in the sections that follow.
| Category | Solution | Best for | Key strengths | Things to consider |
| Cost Monitoring & Optimization | Finout | Allocating and optimizing K8s cluster costs | Agentless setup, 100% cost allocation, virtual tagging, rightsizing | Cloud-based deployment only; setup time for complex environments |
| Cost Monitoring & Optimization | OpenCost | Free, vendor-neutral open-source K8s cost allocation | CNCF Incubating, pod-level allocation, cloud cost integrations, MCP server | Requires Prometheus; no bill reconciliation; one instance per cluster || Cost Monitoring and Optimization |
| Cost Monitoring & Optimization | IBM Kubecost | Real-time K8s cost visibility and rightsizing | Allocation by K8s object, cloud bill reconciliation, automation | Billing integration centered on AWS/GCP/Azure; K8s-focused |
| Full-Stack Observability & APM | Datadog | Unified metrics, logs, traces, and security | 1,000+ integrations, auto-discovery, Watchdog, autoscaling | Usage-based pricing can escalate; learning curve |
| Full-Stack Observability & APM | Dynatrace | AI-driven root cause across full-stack K8s | Davis AI, OneAgent auto-discovery, full-stack plus security | Premium pricing; steep learning curve; config complexity |
| Full-Stack Observability & APM | New Relic | No-code, eBPF-based observability with APM | One-step install, eBPF instrumentation, OTel/Prometheus UIs | Pricing complexity at scale; UI navigation |
| Full-Stack Observability & APM | Sysdig Monitor | Managed Prometheus with deep container visibility | Managed Prometheus, eBPF visibility, cost optimization | No native tracing/logging; ingestion cost at scale |
| Open-Source Monitoring & Metrics | Prometheus | The open-source standard for K8s metrics | PromQL, multi-dimensional model, service discovery, ecosystem | Basic built-in UI; no long-term storage; PromQL curve |
| Open-Source Monitoring & Metrics | Grafana | Flexible dashboards across many data sources | 150+ data source plugins, rich visualizations, alerting | Learning curve; complex dashboards need JSON |
| Open-Source Monitoring & Metrics | cAdvisor | Per-node container resource metrics | Auto-discovery, built into kubelet, Prometheus metrics, REST API | Basic metrics only; no storage or alerting |
| Open-Source Monitoring & Metrics | SigNoz | Open-source, OpenTelemetry-native observability | OTel-native, unified signals, ClickHouse backend, flexible querying | Newer project; self-hosting manages ClickHouse |
| Logging & Distributed Tracing | Elastic Observability | Search-powered log analytics with K8s monitoring | Powerful search/TSDB, ES|QL, OTel/Prometheus-native, ML | Complex setup; resource-intensive; pricing/sizing |
| Logging & Distributed Tracing | Jaeger | Open-source distributed tracing for microservices | OpenTelemetry support, multiple storage backends, dependency analysis | Tracing-only scope; self-hosted overhead |
| Logging & Distributed Tracing | Grafana Lok | Cost-efficient log aggregation for Kubernetes | Label-based indexing, object storage, LogQL, real-time tailing | No full-text content indexing; depends on Grafana |
Related content: Compare the best Kubernetes cost management solutions.
Traditional infrastructure monitoring is typically focused on static servers, virtual machines, and network devices, where components remain relatively stable over time. Monitoring solutions for such environments rely on host-based agents and predefined metrics, such as CPU, memory, disk, and network usage. In contrast,
Kubernetes monitoring must track not only the underlying infrastructure but also the orchestration layer and the containerized workloads themselves. It needs to understand constructs like namespaces, deployments, replica sets, and services, correlating metrics, logs, and events at multiple layers. Kubernetes environments are highly dynamic, with containers and pods being orchestrated, scheduled, and terminated automatically based on load and deployment strategies. This volatility requires monitoring tools to adapt in real time and provide context-aware insights.
The ephemeral nature of containers and the abstraction of resources require solutions that can map transient workloads back to logical applications and business services, making Kubernetes monitoring fundamentally more complex and context-driven than its traditional counterpart.
Kubernetes environments are defined by their dynamic orchestration of workloads. Pods and containers can be spun up or destroyed within seconds based on scaling policies or deployment updates. This constant churn makes it difficult for traditional monitoring tools to keep up, as resource identifiers frequently change and monitoring agents may not persist long enough to provide meaningful data. The challenge intensifies when troubleshooting issues, since the container or pod that experienced a problem may no longer exist by the time an alert is triggered or an engineer begins investigating.
How to address:
To handle this, you need tools that integrate tightly with the orchestration layer, leveraging APIs and service discovery mechanisms to automatically track and update resource information in real time. They need to capture telemetry data as soon as a workload is deployed and ensure that logs and metrics are preserved for later analysis, even after a resource is terminated.
Modern Kubernetes applications are typically composed of numerous microservices, each running in its own container and communicating over the network. This distributed architecture introduces a web of dependencies that can complicate monitoring efforts. Issues in one microservice can quickly cascade to others, making it challenging to pinpoint the root cause of failures or performance bottlenecks. Monitoring tools must be able to map these dependencies and visualize service interactions to provide meaningful insights.
How to address:
To handle this, you need deep visibility into service-to-service communications, including latency, request rates, and error rates. Tools need to support distributed tracing and dependency mapping to help operators understand how individual microservices interact within the larger application ecosystem.
Kubernetes environments generate vast amounts of telemetry data, including metrics, logs, and traces from every node, pod, and container. This data deluge can quickly overwhelm traditional monitoring solutions, leading to storage, processing, and retention challenges. High-frequency metrics, verbose logs, and distributed traces all compete for resources, making it essential to have robust data aggregation, filtering, and retention strategies in place.
How to address:
To handle this scale, you need tools that provide efficient data ingestion pipelines and storage backends. They should offer options for data sampling, log aggregation, and retention policies to balance visibility with cost and performance.
Kubernetes clusters are constantly evolving as new deployments, scaling events, and configuration changes occur. However, gaining visibility into these changes in real time can be difficult, particularly in large or multi-tenant clusters. Traditional monitoring tools may not capture cluster-level events, such as node additions, pod evictions, or configuration updates, leaving operators blind to the reasons behind performance shifts or outages.
How to address:
To close this gap, you need monitoring solutions that track and correlate cluster events alongside application metrics and logs. They need to provide audit trails and change histories, allowing teams to understand the context of operational issues.
Kubernetes monitoring tools excel at collecting metrics in real time from various cluster components, including nodes, pods, and containers. These metrics cover resource usage such as CPU, memory, disk, and network, as well as Kubernetes-specific data like:
Real-time collection ensures that operators can detect and respond to issues as they arise, maintaining high availability and performance. To achieve this, monitoring tools integrate with Kubernetes APIs and use service discovery to automatically identify new resources. They often employ lightweight agents or exporters, such as Prometheus node exporters or cAdvisor, to gather data without adding significant overhead.
One distinction trips teams up: the Kubernetes documentation notes that the metrics pipeline behind Metrics Server only offers the minimum CPU and memory metrics needed for autoscaling. For monitoring, you need a full pipeline such as Prometheus with kube-state-metrics, which exposes the state of Kubernetes objects as metrics.
Centralized log management is critical in Kubernetes environments, where logs are generated by multiple containers across distributed nodes. Monitoring tools aggregate these logs into a central repository, enabling search, filtering, and correlation across all workloads. This approach simplifies troubleshooting by providing a unified view of application and infrastructure events, regardless of where or when they occurred.
Effective log management solutions must handle the high volume and velocity of logs produced in Kubernetes clusters. They offer features such as:
This helps ensure that relevant data is accessible and actionable. By centralizing logs, teams can more easily investigate incidents, comply with audit requirements, and gain operational insights across the entire Kubernetes environment.
Distributed tracing is essential for understanding the flow of requests across microservices in a Kubernetes environment. It enables operators to track requests as they traverse multiple containers and services, providing visibility into:
Tracing data helps pinpoint where performance issues originate and how they propagate through the system, which is especially important in complex, distributed applications. Modern Kubernetes monitoring tools integrate with tracing frameworks such as Jaeger or OpenTelemetry to collect and visualize trace data. They correlate traces with metrics and logs, giving teams a comprehensive view of application behavior.
Kubernetes-aware dashboards provide visual representations tailored to the unique constructs and abstractions of Kubernetes environments. These dashboards display metrics and status information for resources such as:
They offer an at-a-glance view of cluster health and performance. By contextualizing data within the Kubernetes ecosystem, they help operators quickly identify issues and trends. Effective dashboards support filtering, drill-down, and customization, enabling users to focus on specific workloads, namespaces, or time ranges. They often include pre-built visualizations for common scenarios, such as resource utilization, error rates, and deployment changes.
Automated service mapping allows monitoring tools to dynamically discover and visualize the relationships between microservices, workloads, and infrastructure components within a Kubernetes cluster. This capability is vital for:
Service maps help teams navigate complex environments by providing clear, up-to-date representations of how services interact. These maps are generated by continuously monitoring Kubernetes APIs and service communications, ensuring accuracy as the environment evolves. Automated mapping simplifies root cause analysis by showing the downstream effects of incidents and highlighting potential points of failure.
Anomaly detection and intelligent alerting are key features that help teams respond proactively to operational issues in Kubernetes environments. Monitoring tools use machine learning algorithms or statistical models to identify deviations from normal behavior, such as unexpected spikes in resource usage or error rates. This reduces alert fatigue by focusing attention on genuine problems instead of generating noise from routine fluctuations.
Intelligent alerting systems integrate with collaboration tools and incident management platforms to ensure timely notification and response. They allow teams to:
By combining anomaly detection with context-aware alerting, Kubernetes monitoring tools enable faster resolution of incidents and contribute to more stable, reliable operations.
Kubernetes can make infrastructure costs difficult to predict because workloads scale automatically and resources are shared across multiple teams and applications. Monitoring tools address this by tracking CPU, memory, storage, and network consumption at the cluster, namespace, deployment, and pod levels. They help identify:
These elements increase cloud spending without improving application performance. Many Kubernetes monitoring platforms also provide cost allocation, forecasting, and optimization recommendations. By combining resource usage with cloud pricing data, they can estimate the cost of individual applications, environments, or business units.
That matters beyond the cluster: the FinOps Foundation's State of FinOps 2026 found that workload optimization and waste reduction remain the single top current priority for FinOps teams.
Three changes this year affect which collectors and dashboards you should standardize on for Kubernetes monitoring.
These tools split into four jobs: cost monitoring, full-stack observability, open-source metrics, and logging and tracing. Most production clusters run at least two of them.
Best for: FinOps and engineering teams allocating and optimizing K8s cluster costs.
Strengths: Agentless integration, 100% cost allocation, Virtual Tags, and rightsizing.
Things to consider: Deployment is cloud-based, and complex environments take time to configure.
Finout is an enterprise-grade FinOps platform for cloud and AI spend. For Kubernetes, Finout connects cluster resource usage with the underlying cloud infrastructure costs to allocate 100% of cluster spend to the teams and features that use it. Finout ingests metric data through agentless integrations with Prometheus, Datadog, or AWS CloudWatch. Teams drill down from the cluster level to namespace, deployment, label, and pod, and calculate unit economics such as cost per tenant or cost per transaction.
Key features include:
Limitations (as reported by users onG2):
Best for: Teams wanting free, vendor-neutral, open-source Kubernetes cost allocation.
Strengths: CNCF Incubating project, allocation down to the pod, and cloud cost integrations.
Things to consider: It requires Prometheus, does not reconcile to billed costs, and runs one instance per cluster.
OpenCost is a vendor-neutral, open-source project for measuring and allocating cloud infrastructure and container costs in real time. Originally developed and open-sourced by Kubecost, it is a CNCF Incubating project.
Key features include:
Limitations (based on OpenCost documentation):
Best for: Engineering teams needing real-time Kubernetes cost visibility and rightsizing.
Strengths: Allocation by K8s object, cloud bill reconciliation, and automated actions.
Things to consider: Billing integrations focus on AWS, GCP, Azure, and Oracle, and the scope centers on Kubernetes spend.
IBM Kubecost provides real-time visibility, allocation, optimization, and governance for teams running Kubernetes. It breaks down spend by cluster, namespace, workload, and shared resource, and reconciles those costs with the cloud bill for defensible showback and chargeback. Kubecost operates across multi-cloud and hybrid environments, combining native cloud billing with custom pricing in a lightweight architecture.
Key features include:
Limitations (as reported by users onG2):
Best for: Teams wanting unified metrics, logs, traces, and security in one platform.
Strengths: Broad integrations, auto-discovery, Watchdog anomaly detection, and autoscaling.
Things to consider: Usage-based pricing can escalate, and the platform has a learning curve.
Datadog offers visibility into the health, performance, security, and resource usage of Kubernetes environments, auto-discovering nodes, pods, and containers. Customizable dashboards display Kubernetes data alongside metrics from Istio, Karpenter, Vault, and more than 1,000 partner-backed integrations. Observability data from Kubernetes components is correlated within a Kubernetes Overview page.
Key features include:
Limitations (as reported by users on G2):
Best for: Enterprises wanting AI-driven root cause analysis across full-stack Kubernetes.
Strengths: Dynatrace Intelligence root cause, OneAgent auto-discovery, and full-stack plus security.
Things to consider: Premium pricing, a steep learning curve, and configuration complexity.
Dynatrace manages the health, performance, and security of containerized applications and multi-cloud infrastructure with metrics, traces, and logs in one platform. It continuously discovers and monitors Kubernetes nodes and pods, and shows metrics, events, and logs from pods and nodes in a single view. The platform supports the major Kubernetes distributions and more than 900 integrations.
Key features include:
Limitations (as reported by users onG2):
Best for: Teams wanting no-code, eBPF-based observability correlated with APM.
Strengths: One-step install, eBPF instrumentation, and native OTel and Prometheus UIs.
Things to consider: Pricing can be complex at scale, and the UI takes time to navigate.
New Relic connects Kubernetes, applications, and telemetry across the stack, correlating metrics, traces, and logs to speed incident resolution. It tracks memory, CPU, storage, and networking across nodes and pods, and helps identify and resolve errors such as CrashLoopBackOff and OOMKilled. The platform offers a guided one-step install with automatic instrumentation, including no-code observability through eBPF.
Key features include:
Limitations (as reported by users on G2):
Best for: Teams wanting a managed Prometheus service with deep container visibility.
Strengths: Managed Prometheus, eBPF-based visibility, and cost optimization.
Things to consider: Ingestion cost grows at scale, and the interface takes time to learn.
Sysdig Monitor provides Kubernetes and cloud monitoring with a managed Prometheus service. It delivers deep visibility into container and Kubernetes workloads using granular data derived from system calls enriched with cloud and Kubernetes context, alongside Prometheus metrics. The managed Prometheus service offers a scalable data store, automatic service discovery, out-of-the-box dashboards and alerts, and curated exporters.
Key features include:
Limitations (as reported by users onG2):
Best for: Teams wanting a CNCF-graduated, open-source system for Kubernetes metrics and alerting.
Strengths: PromQL, a multi-dimensional data model, service discovery, and a large ecosystem.
Things to consider: The built-in UI is basic, storage is local, and PromQL takes learning.
Prometheus is an open-source monitoring system and time-series database that collects, stores, and queries metrics for alerting and dashboarding. It was the second project to graduate from the CNCF after Kubernetes, and 77% of respondents in the CNCF’s 2025 Annual Cloud Native Survey use it in production. It models time series in a flexible dimensional data model, with each series identified by a metric name and a set of key-value pairs. Prometheus integrates with Kubernetes to continuously discover and monitor services.
Key features include:
Limitations (as reported by users onG2):
Best for: Teams needing flexible dashboards that unify many data sources.
Strengths: Many data source plugins, rich visualizations, alerting, and dashboards as code.
Things to consider: There is a learning curve, and dashboard sprawl can be hard to manage without as-code tooling.
Grafana is an open-source data visualization and monitoring solution that collects, correlates, and visualizes data through dashboards. With more than 150 plugins, it unifies data sources into a single pane of glass for monitoring and troubleshooting across metrics, logs, and traces. The tool offers a growing suite of visualizations, from time series graphs to heatmaps and 3D charts, and supports managing observability as code.
Key features include:
Limitations (as reported by users onG2):
Best for: Per-node container resource metrics that feed a metrics pipeline.
Strengths: Auto-discovery, integration with the kubelet, Prometheus metrics, and a REST API.
Things to consider: It collects basic metrics only, with no storage or alerting.
cAdvisor (Container Advisor) is a running daemon that collects, aggregates, processes, and exports information about running containers. For each container it keeps resource isolation parameters, historical resource usage, histograms of historical usage, and network statistics, exported per container and machine-wide. It has native support for Docker containers and works with other container types, and can run standalone, as a Docker container, or as a DaemonSet in Kubernetes.
Key features include:
Limitations (based on cAdvisor documentation):
Best for: Teams wanting an open-source, OpenTelemetry-native observability platform.
Strengths: OTel-native design, unified signals, a ClickHouse backend, and flexible querying.
Things to consider: Self-hosting means operating ClickHouse, and cloud costs track telemetry volume.
SigNoz is an open-source, OpenTelemetry-native observability platform that brings logs, metrics, traces, dashboards, and alerts into a single application. It provides application performance monitoring, distributed tracing, log management, metrics and dashboards, and LLM/AI observability, and ingests data through OpenTelemetry, Prometheus, and a library of integrations for cloud providers, databases, and Kubernetes. The platform is built for OpenTelemetry and uses ClickHouse as its columnar backend for high-performance data handling.
Key features include:
Limitations (based on SigNoz documentation):
Best for: Teams needing search-powered log analytics with full-stack K8s monitoring.
Strengths: Powerful search and TSDB, ES|QL across signals, and OTel-native ingest.
Things to consider: Setup is complex, it can require significant storage, and sizing takes planning.
Elastic Observability provides real-time visibility into Kubernetes across EKS, GKE, AKS, on-prem, and air-gapped environments, pairing Kubernetes monitoring with log analytics and a metrics engine. On connection, it loads dashboards, alerts, SLOs, machine learning jobs, and agent skills without manual configuration. The platform auto-discovers container workloads and populates prebuilt dashboards for clusters, nodes, pods, and namespaces.
Key features include:
Limitations (as reported by users onG2):
Best for: Teams wanting an open-source distributed tracing backend for microservices.
Strengths: OpenTelemetry support, multiple storage backends, and dependency analysis.
Things to consider: It covers tracing only, and self-hosting adds operational overhead.
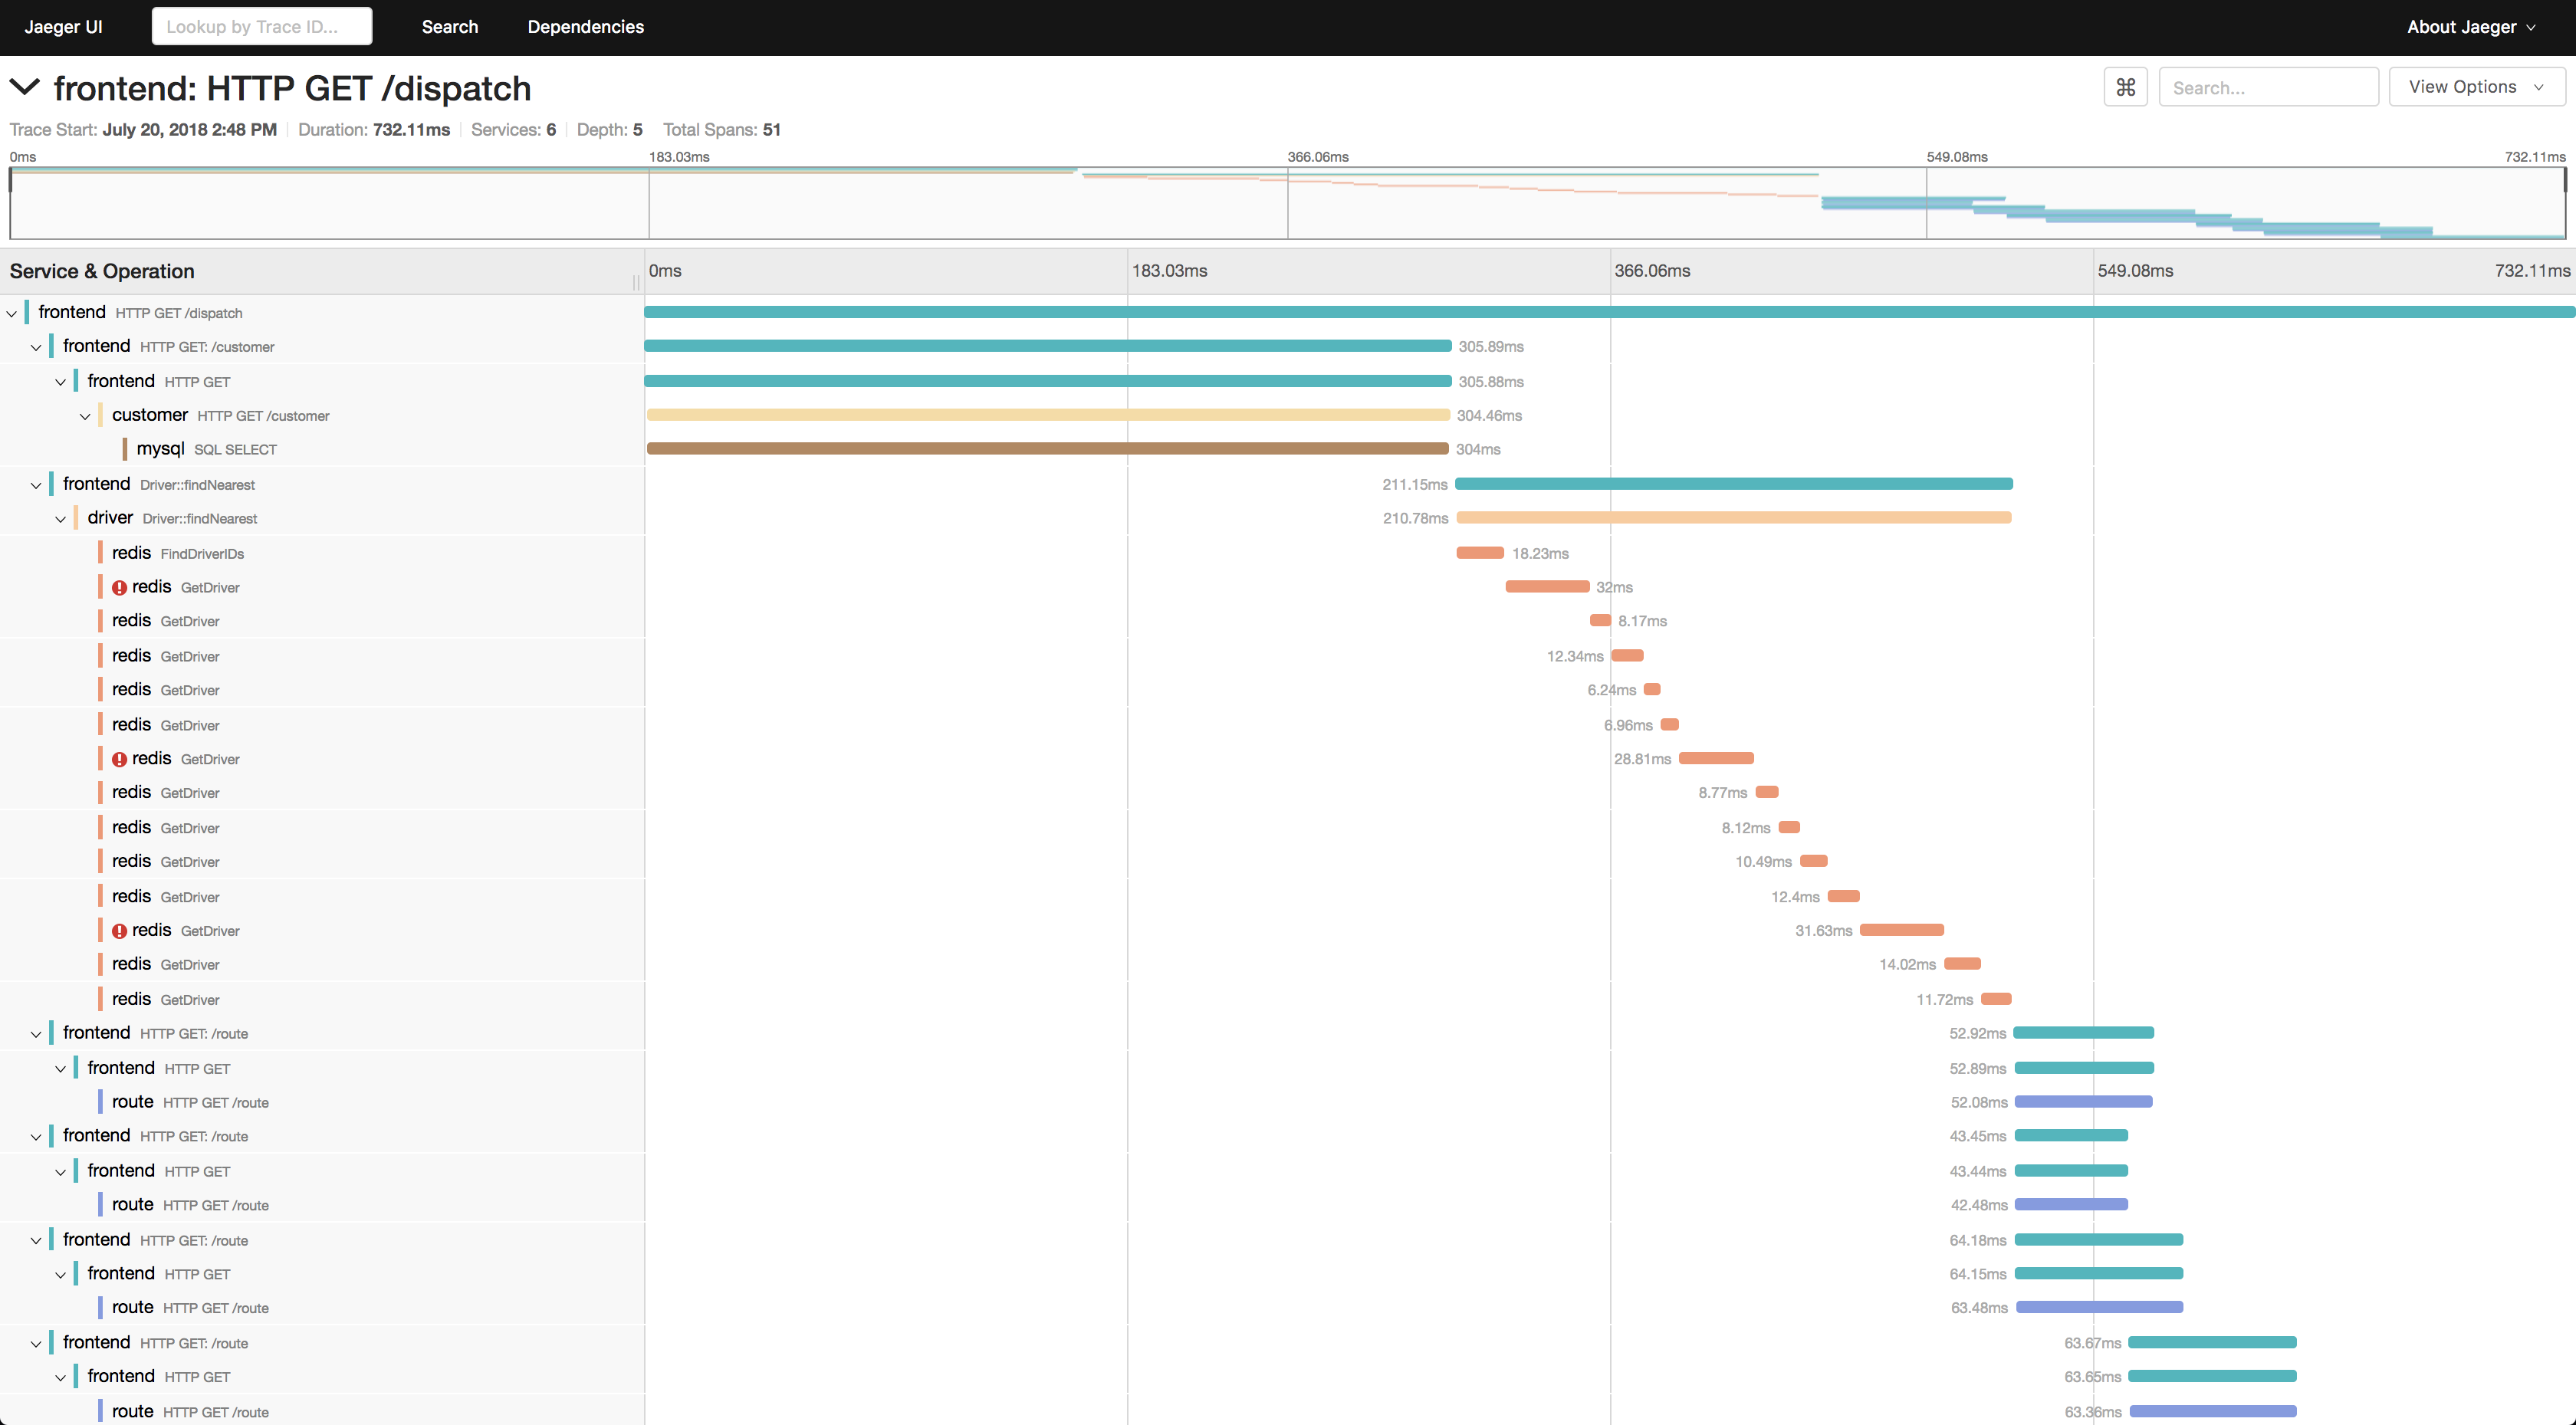
Jaeger is an open-source, distributed tracing platform used to monitor and troubleshoot workflows in complex distributed systems. It maps the flow of requests and data as they traverse services, connecting disparate components to identify performance bottlenecks, troubleshoot errors, and analyze service dependencies. Jaeger is open source, cloud native, and one of the graduated projects in the CNCF.
Key features include:
Limitations (based on Jaeger documentation):
Best for: Cost-efficient log aggregation for Kubernetes alongside Grafana and Prometheus.
Strengths: Label-based indexing, object storage, LogQL, and real-time tailing.
Things to consider: It does not index log content, and logs are usually explored through Grafana.
Grafana Loki is a horizontally scalable, highly available, multi-tenant log aggregation system inspired by Prometheus. Rather than indexing the contents of logs, it indexes only a set of labels for each log stream, which reduces the storage required compared with other solutions.
Loki accepts logs in any format from any source and persists them to object storage for petabyte scale. It integrates natively with Prometheus, Grafana, and Kubernetes, collects logs through Grafana Alloy or any OpenTelemetry Collector (Promtail reached end of life on March 2, 2026), and provides the LogQL query language for exploration.
Key features include:
Limitations (as reported by users onPeerSpot):
The right Kubernetes monitoring stack depends on which question you need answered: is the cluster healthy, why is it slow, what happened in the logs, and who owns the cost.
Kubernetes monitoring requires visibility across infrastructure, orchestration, and applications to keep highly dynamic containerized environments reliable and efficient. If you run Kubernetes in production, combine real-time metrics, centralized logs, distributed tracing, intelligent alerting, and cost monitoring to quickly detect issues, understand service dependencies, and optimize resource utilization. By adopting monitoring practices designed specifically for Kubernetes, you can improve application availability, accelerate troubleshooting, control infrastructure costs, and operate cloud-native workloads with greater confidence at scale.
Your monitoring stack already collects pod-level usage. Finout reads that data through agentless connections to Prometheus, Datadog, or AWS CloudWatch, then joins it with the cloud bill to show who owns each part of your Kubernetes spend.
At Lyft, Finout raised cost attribution from 80% to over 96% and cut anomaly detection time from weeks to days.