CFOs in modern organizations face numerous challenges, including managing increasing volumes of data, balancing short-term financial health with long-term strategic goals, and responding swiftly to market changes. The complexity of global operations, regulatory requirements, and the demand for detailed financial reporting add layers of difficulty to their role. Traditional financial tools and processes often fall short, making it hard to derive actionable insights from the vast amounts of financial data generated daily.
A CFO dashboard addresses these challenges by leveraging technology to centralize, visualize, and analyze financial data in real-time. Modern dashboards integrate seamlessly with ERP, accounting, and business intelligence systems, presenting key metrics in an interactive and accessible format. This empowers CFOs to move beyond static reporting, enabling them to monitor performance dynamically, identify trends, and make data-driven decisions with speed and confidence.
This is part of a series of articles about cloud cost management.
Related Content:
CFO dashboards transform raw financial data into actionable insights, helping CFOs save time and make better decisions. Below are the key advantages of dashboards for modern CFO roles:
Related content: Read our guide to FinOps tools.
A CFO dashboard and a CFO report serve distinct yet complementary purposes in financial management:
The primary difference lies in their functionality. CFO dashboards offer live updates and allow users to drill down into specific data points for deeper analysis, making them suitable for real-time monitoring and quick adjustments. CFO reports can be more comprehensive, offering detailed narrative explanations, historical comparisons, and contextual analysis.
A Cloud Cost Dashboard helps CFOs monitor and manage the financial impact of cloud services. As companies increasingly rely on cloud infrastructure, tracking cloud costs becomes crucial to controlling operational expenditures. This dashboard provides a detailed breakdown of cloud expenses, helping CFOs identify areas where costs can be optimized or reduced.
Example dashboard: Finout
Metrics Covered:
A Sales Dashboard consolidates key sales metrics to give CFOs a clear picture of revenue generation. It allows monitoring of sales performance across different regions, teams, and products, helping CFOs ensure the company is on track to meet revenue goals. This dashboard is critical for analyzing sales trends and identifying areas for growth.
Example dashboard: HubSpot
Typical metrics covered:
The Cash Flow Dashboard tracks the movement of cash in and out of the organization, providing CFOs with real-time visibility into liquidity. This dashboard helps in managing short-term financial stability by identifying cash surpluses or shortages, ensuring the company has enough liquidity to cover operational needs and avoid cash flow issues.
Example dashboard: Databox
Typical metrics covered:
A Customer Ledger Dashboard offers a comprehensive view of all customer-related financial data. It tracks payments, outstanding invoices, and credits, providing CFOs with essential insights into customer payment behavior and overall financial health. This helps in managing accounts receivable more effectively.
Example dashboard: HouseOfControl
Typical metrics covered:
The Expense Management Dashboard enables CFOs to monitor and control company expenses, ensuring that costs are aligned with budgets. This dashboard helps in identifying areas of overspending and highlights opportunities for cost savings across departments.
Example dashboard: Databox
Typical metrics covered:
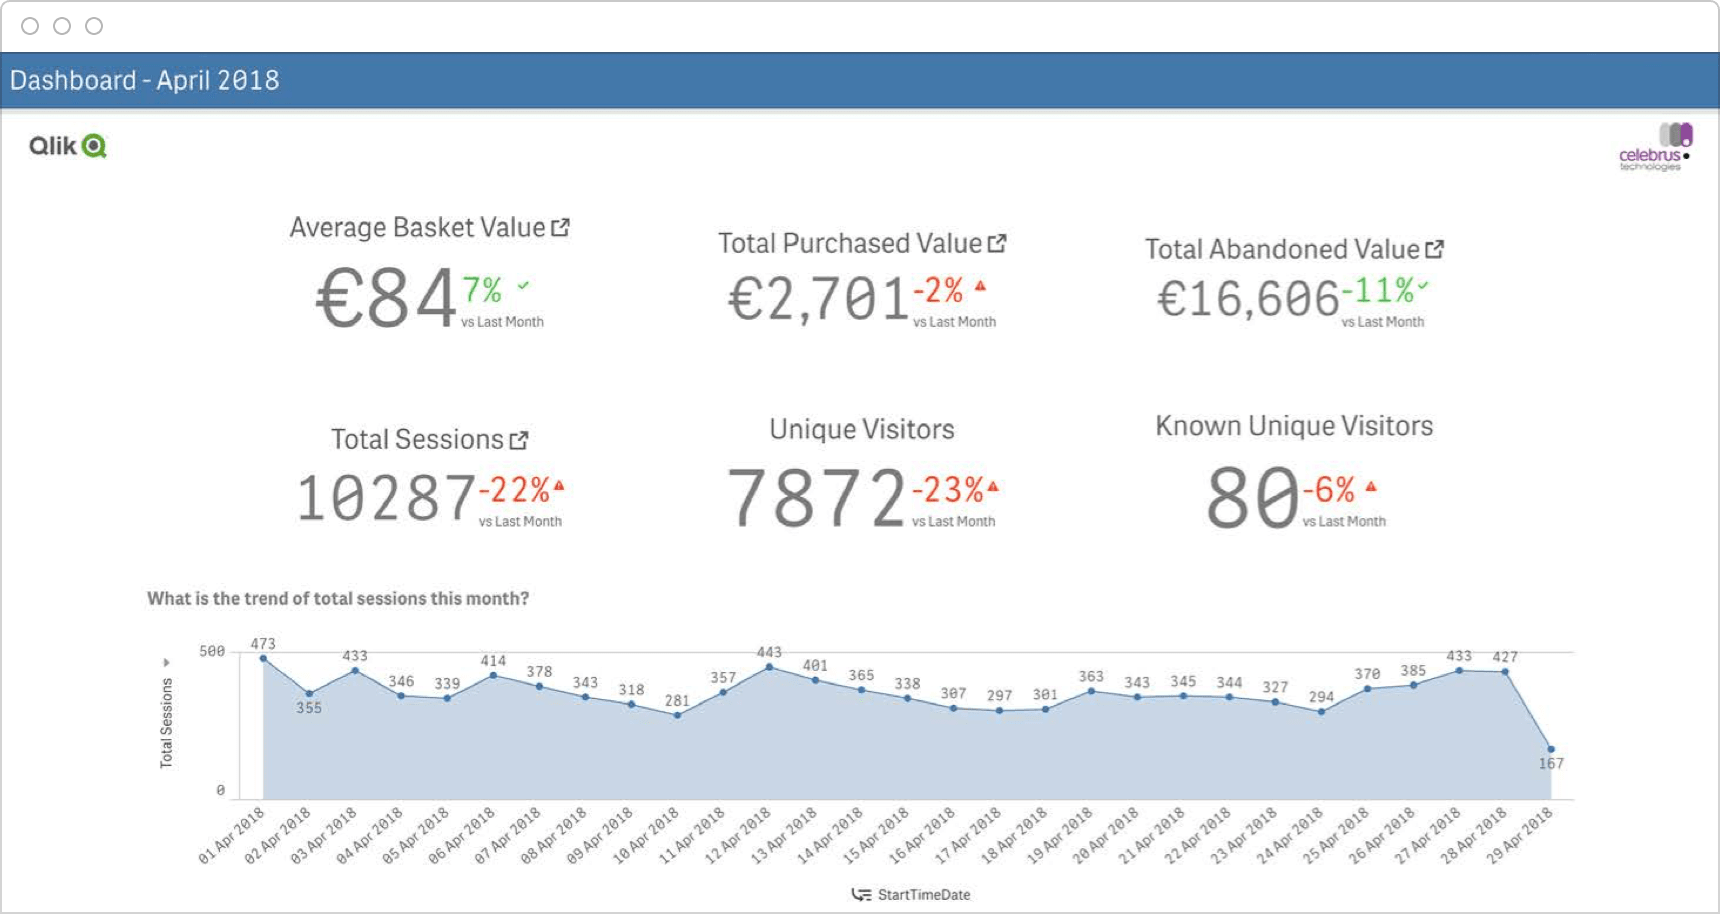
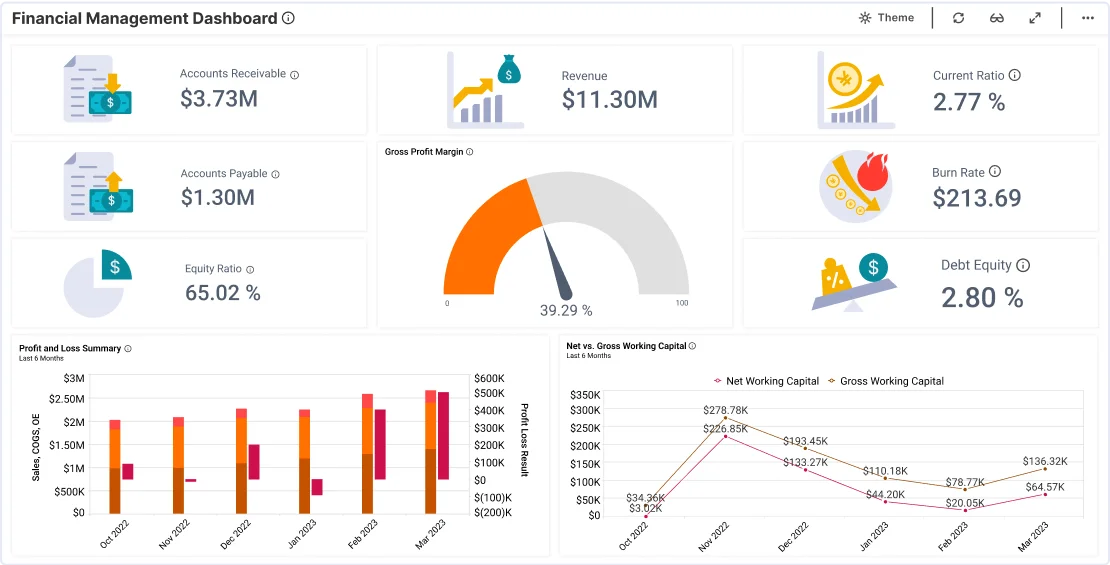
A KPI Overview Dashboard provides a high-level summary of key performance indicators (KPIs) critical to the organization’s financial health. This dashboard enables CFOs to monitor the company’s financial and operational performance against strategic objectives.
Example dashboard: Qlik
Typical metrics covered:
A Profit & Loss (P&L) Dashboard provides a snapshot of the company’s revenues, costs, and expenses over a specific period. This dashboard enables CFOs to track profitability, ensuring that the company is meeting its financial goals and identifying areas for cost reduction.
Example dashboard: BoldBI
Typical metrics covered:
The Forecast Dashboard is designed to help CFOs project future financial performance. By leveraging historical data and predictive analytics, this dashboard provides insights into potential financial outcomes, allowing CFOs to plan more effectively and adjust strategies based on up-to-date forecasts.
Example dashboard: Salesloft
Typical metrics covered:
Related content: Read our guide to cloud cost management tools
For CFOs, navigating the complexities of cloud cost management is an increasingly critical responsibility. As organizations scale, cloud expenses can become fragmented across teams, departments, and projects, making transparency and accountability a challenge. Finout provides CFOs with the tools and insights needed to take full control of cloud spend, enabling strategic financial decisions and ensuring alignment with organizational goals.
How Finout Empowers CFOs:
Finout transforms cloud cost management from a reactive process to a proactive strategy, giving CFOs the transparency and control they need to optimize spend and drive business success.